GBIF data in Latin America
The contributions and taxonomical biases encountered in GBIF for the region.
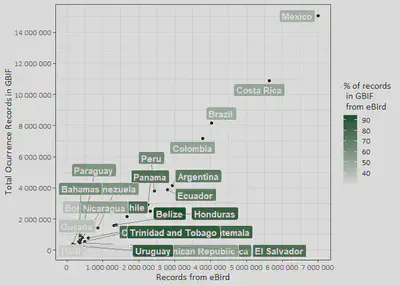
In our recent Data Paper, we showed that Uruguay ranks amongst the countries of Latin America with the lowest levels of available data on their biodiversity in the Global Biodiversity Information Facility GBIF. Also, that most of the records that we found in GBIF belong to the eBird initiative, the world’s largest biodiversity-related citizen science project. The extensive contribution provided by eBird to GBIF highlights the enormous role that data provided by citizens play in the development of global biodiversity datasets, while at the same time, points out the critical taxonomical biases encountered in GBIF for the region.
Here is the code to build the data table from scratch using the rgbif package to retrieve data from GBIF. Let’s start! To run this code, you will need the following R packages:
library(rgbif)
library(ggrepel)
library(extrafont)
library(tidyverse)
Latin America
First, we create a list of Latin American countries and codes, and a variable for the eBird dataset key. Find the ISO CODES of countries here.
LatinAmerica <- data.frame(country= c('Mexico', 'Brazil', 'Costa Rica', 'Colombia', 'Peru', 'Argentina', 'Ecuador', 'Panama', 'Chile', 'Venezuela', 'Belize', 'Honduras', 'Bolivia', 'Guatemala', 'Cuba', 'Nicaragua', 'Paraguay', 'Bahamas', 'Jamaica', 'Trinidad and Tobago', 'Guyana', 'Dominican Republic', 'El Salvador', 'Suriname', 'Uruguay', 'Haití'), code=c('MX', 'BR', 'CR', 'CO', 'PE', 'AR', 'EC', 'PA', 'CL', 'VE', 'BZ', 'HN', 'BO', 'GT', 'CU', 'NI', 'PY', 'BS', 'JM', 'TT', 'GY', 'DO', 'SV', 'SR', 'UY', 'HT'))
eBirdKey <- '4fa7b334-ce0d-4e88-aaae-2e0c138d049e'
If you wanted to search other dataset sources and don’t know the key
value, you could check the function datasets() and return a list of
datasets matching the query search
datasets(data='all', query='eBird')
Function
Next, we declare the function, that takes a list of countries and codes, and returns for each country the count of the total number of occurrence records and the number of those that belong to eBird.
count_country_records <- function(List){
CountryList <- data.frame(country = character(),
code = character(),
numberOfRecords = numeric(),
eBirdRecords = numeric(), stringsAsFactors=FALSE)
for (code in List$code){
numberOfRecords_country <- occ_count(country=code, georeferenced=TRUE)
numberOfRecords_country_eBird <- occ_count(country=code, datasetKey= eBirdKey, georeferenced=TRUE)
CountryList_country <- data.frame(country = List[List$code==code,1],
code = code,
numberOfRecords = numberOfRecords_country,
eBirdRecords = numberOfRecords_country_eBird, stringsAsFactors=FALSE)
CountryList <- rbind(CountryList, CountryList_country)
}
return(CountryList)
}
Now we run the function to create the data
LatinAmerica <- count_country_records(LatinAmerica)
## country code numberOfRecords eBirdRecords
## 1 Mexico MX 15043237 6992473
## 2 Brazil BR 8169257 4023507
## 3 Costa Rica CR 10890424 5634356
## 4 Colombia CO 7166734 3776681
## 5 Peru PE 3798876 2442519
## 6 Argentina AR 4148032 2940847
## 7 Ecuador EC 3867735 2806824
## 8 Panama PA 2932335 2261739
## 9 Chile CL 2152025 1676229
## 10 Venezuela VE 1445854 859298
## 11 Belize BZ 2491648 2318225
## 12 Honduras HN 1603648 1375775
## 13 Bolivia BO 944213 375645
## 14 Guatemala GT 1579952 1318613
## 15 Cuba CU 779373 606691
## 16 Nicaragua NI 807919 432861
## 17 Paraguay PY 650151 390653
## 18 Bahamas BS 533186 341283
## 19 Jamaica JM 333306 241219
## 20 Trinidad and Tobago TT 566399 500421
## 21 Guyana GY 404496 161875
## 22 Dominican Republic DO 322126 179115
## 23 El Salvador SV 472999 371781
## 24 Suriname SR 175728 55151
## 25 Uruguay UY 286433 253805
## 26 Haití HT 110039 38016
Plot
We will plot the distribution of the number of occurrence records available GBIF (as for the date of the query) for each country of Latin America, relative to the number of records that have been submitted by eBird users. The respective proportion will be shown in the green scale.
ggplot(LatinAmerica, aes(eBirdRecords, numberOfRecords, label = country)) +
geom_point(aes(fill= eBirdRecords*100/numberOfRecords)) +
geom_label_repel(aes(fill = (eBirdRecords*100/numberOfRecords)),
colour = "white", fontface = "bold", segment.color = 'grey50') +
labs(y='Total Ocurrence Records in GBIF',
x='Records from eBird',
fill='% of records\n in GBIF\n from eBird') +
scale_fill_gradient(low = "#f2f2f2", high ="#00441b") +
scale_y_continuous(breaks = seq(0, 18000000,2000000), labels = scales::number) +
scale_x_continuous(breaks = seq(0, 7000000,1000000), labels = scales::number) +
theme_bw() +
theme(text=element_text(family='Calibri', size=12))

Maybe you should zoom in to see the details :)
And that’s all !
Check our Data Paper for more info:
Grattarola F, Botto G, da Rosa I, Gobel N, González E, González J, Hernández D, Laufer G, Maneyro R, Martínez-Lanfranco J, Naya D, Rodales A, Ziegler L, Pincheira-Donoso D (2019) Biodiversidata: An Open-Access Biodiversity Database for Uruguay. Biodiversity Data Journal 7: e36226. https://doi.org/10.3897/BDJ.7.e36226